R and Python Together in Jupyter Notebooks
Get the best of R and Python together in a single Jupyter Notebook with rpy2

I'm a huge fan of Python, but I have to admit that using R often has advantages. Python has the bigger ecosystem but R has some amazing packages: ggplot2 for example is a wonderful graphics package and the tidyverse in general has some fantastic features. In the world of statistics its often the case that R libraries are just a bit more comprehensive and polished than their Python counterparts.
Wouldn't it be great though if you could have the best of both worlds? Well you can! Enter the Python package rpy2 which is 'an interface to R running embedded in a Python process' or more simply allows you to call R from Python.
There are lots of ways to use it but for simple tasks in a Jupyter Notebook my favourite is to use the %%R 'magic' command. This allows you to write pure R code in a cell in a Python notebook and make results from that cell available to your Python code in later cells.
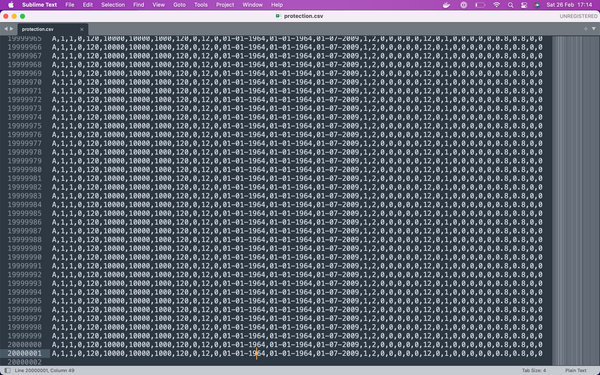
Let's look at an example that will be useful to some actuaries. We want to model copulas and we'd prefer to use R's copula package, which is more comprehensive than its Python equivalent.
We start with an empty Python notebook. Once we have the rpy2 package installed we need one line of code to start to use it.
%reload_ext rpy2.ipythonWe can now tell Python that we want to include R code in a notebook cell by using the %%R 'magic' command.
We need to be able to access the results generated by the R code though, and we can do this using the '-o' and passing the name of the variable we want to pass to Python, in this case Z2.
So lets generate a copula in R (adapted from this excellent R-bloggers article on modelling copulas in R):
%%R -o Z2
library(copula)
set.seed(100)
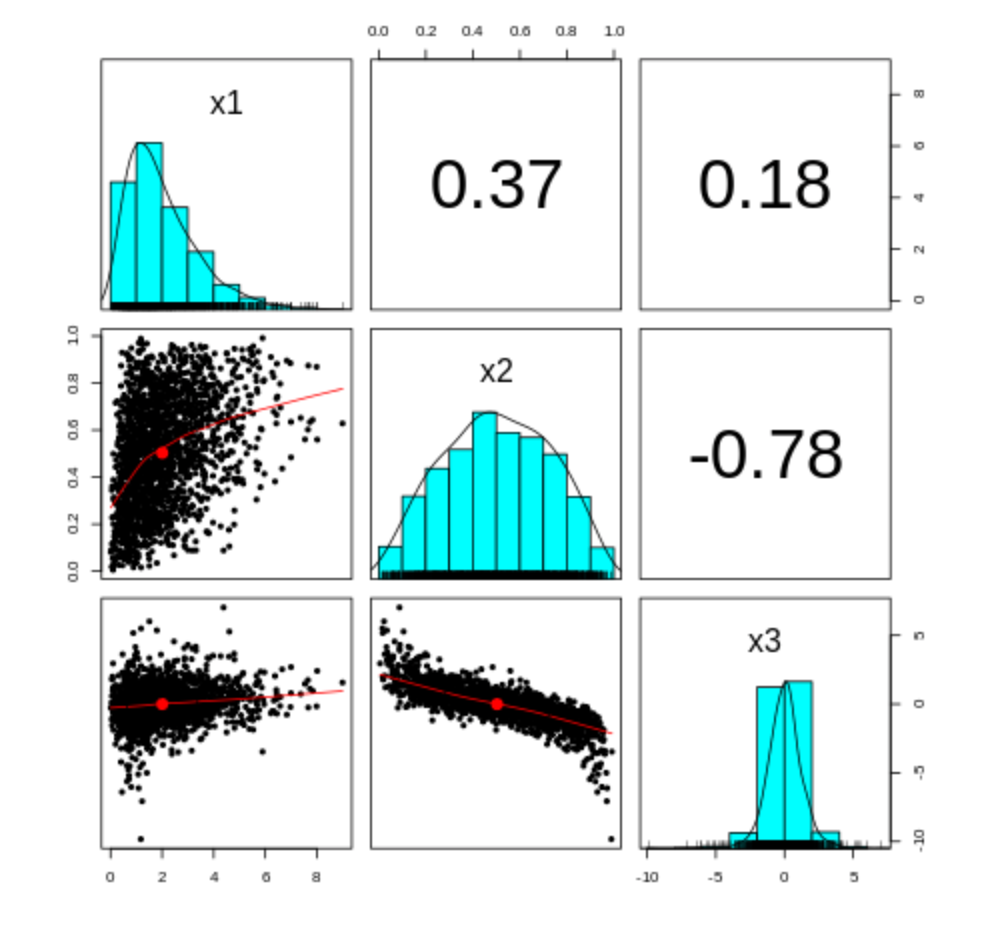
myCop <- normalCopula(param=c(0.4,0.2,-0.8), dim = 3, dispstr = "un")
myMvd <- mvdc(copula=myCop, margins=c("gamma", "beta", "t"),
paramMargins=list(list(shape=2, scale=1),
list(shape1=2, shape2=2),
list(df=5)
) )
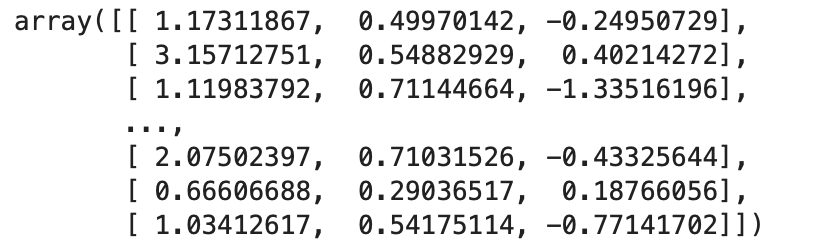
Z2 <- rMvdc(2000, myMvd)
colnames(Z2) <- c("x1", "x2", "x3")We can now access Z2 in Python, where it has magically appeared as a NumPy array.
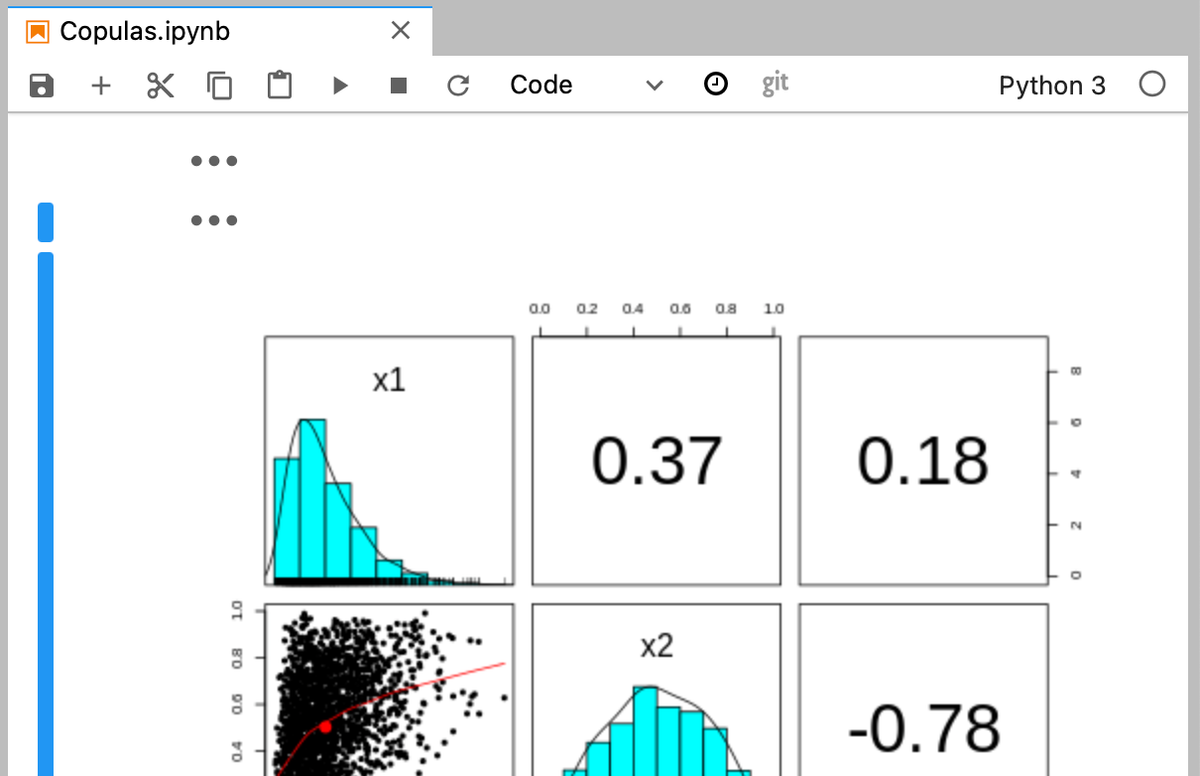
We can also access the graphical capabilities of R, in this case using the panels command. So in a new notebook cell we can write:
%%R
library(psych)
pairs.panels(Z2)
Which generates a really nice panels plot.
Finally, it's also possible to pass values from Python to R by using the '-i' option in the %%R command. For example, this passes the Python variable Z3 to R which is then available to the R code in the rest of this cell.
%%R -i Z3So only two extra lines of code to get full access to R in your Python notebook!
The simple notebook we've created is available for download here.
We've only scratched the surface here and rpy2 has lots more really useful, capabilities. It's well worth investigating further.
Please subscribe to receive email updates of future posts, using the button on the bottom right.
Please also get in touch if you’d like to discuss any topic we cover or share how you're using data science tools in your work: contact details are on the 'Contact' page accessible through the menu at the top of this page. Or alternatively share your thoughts in the comments below.